
If you manage a cold chain facility, a warehouse, a hospital store or a temperature controlled shipments, you have probably asked yourself the same question once- Where should the new set of temperature data loggers you have ordered go? Temperature mapping answers this very question.
You want the placement that gives you the most accurate monitoring. You want to catch excursions early, not after the batch has already been dispatched. And you want your sensors sitting at the points where the most temperature sensitive stock is actually at risk.
Guessing does not work here. A temperature data logger taped next to the cooling unit will read cold and calm all day while a pallet in the far corner quietly drifts to 9 °C. The only reliable way to find the right spots is to measure the whole space first.
That measurement exercise is temperature mapping.
This guide covers what temperature mapping is, how it is done in storage and in transit, what the regulators ask for, and the mistakes that cost companies a repeat study.
Key Takeaways About Temperature Mapping
- Temperature mapping is a documented study that measures how temperature varies across every part of a storage space or vehicle. It finds the hot spots and the cold spots.
- The output of a temperature mapping study is what tells you where to permanently install your monitoring sensors. Temperature mapping first, monitoring second.
- WHO guidance says every new temperature controlled storage area must be mapped before it is used for sensitive pharmaceutical products.
- Warehouses are usually mapped for at least 7 days. Cold rooms and freezer rooms are usually mapped for 24 to 72 hours.
- Mapping temperature data logger devices need a valid 3 point calibration certificate with an error no greater than plus or minus 0.5 °C at each point.
- For vehicles, temperature probes go inside the product packaging, and tests are repeated with full and light loads in both the hottest and coldest seasons.
- Remap every two to three years, and immediately after any change to layout, racking, refrigeration equipment or set point.
What we cover in this detailed guide on temperature mapping?
- 1. What is temperature mapping?1. What is temperature mapping?
- 2. Why is temperature mapping necessary for temperature-sensitive products?2. Why is temperature mapping necessary for temperature-sensitive products?
- 3. How does temperature mapping work?3. How does temperature mapping work?
- 4. Where should temperature mapping be done in a storage space and vehicle?4. Where should temperature mapping be done in a storage space and vehicle?
- 5. What role does a temperature data logger play in temperature mapping?5. What role does a temperature data logger play in temperature mapping?
- 6. How to choose the right temperature data logger for temperature mapping?6. How to choose the right temperature data logger for temperature mapping?
- 7. Which data loggers should you choose for temperature mapping?7. Which data loggers should you choose for temperature mapping?
- 8. Temperature mapping in Indian conditions: What changes on the ground?8. Temperature mapping in Indian conditions: What changes on the ground?
- 9. What does a temperature mapping report contain?9. What does a temperature mapping report contain?
- 10. How does temperature mapping support regulatory compliance and audits?10. How does temperature mapping support regulatory compliance and audits?
- 11. Which guidelines and standards apply to temperature mapping?11. Which guidelines and standards apply to temperature mapping?
- 12. How do Lisaline Asia temperature data logger devices meet the required criteria and guidelines?12. How do Lisaline Asia temperature data logger devices meet the required criteria and guidelines?
- 13. How does Lisaline Asia support temperature mapping of your storage site or shipment vehicle?13. How does Lisaline Asia support temperature mapping of your storage site or shipment vehicle?
- 14. Common temperature mapping mistakes and how to avoid them?14. Common temperature mapping mistakes and how to avoid them?
1. What is temperature mapping?
A cold room is set to set to 5 °C is not 5 °C everywhere. The air leaving the cooling coil is colder. The shelf beside the door warms up every time someone walks in. The top rack of a tall warehouse can sit several degrees above the floor. How would you know these places where a breach could occur? This is what temperature mapping tells you. It gives the full picture not just where a breach is likely to occur but also tells you where to place your temperature data logger devices so that you can catch those excursions when they happen and take corrective action to prevent them from causing product loss.
Meaning of Temperature Mapping
Temperature mapping is the documented measurement of temperature, and often relative humidity, at many points across a storage area or vehicle over a defined period. The goal is to record how the space actually behaves, identify the warmest and coldest points, and decide where product can and cannot be stored. The process also determines where your data loggers should be placed so that they catch temperature excursions early.
The method for thermal mapping is straightforward. You place a grid of calibrated data loggers across the space. Every temperature data logger records at the same interval and starts at the same moment. At the end of the study you download all of them together and compare the readings point by point. What you get is a map of the space, not a single number.
2. Why is temperature mapping necessary?
Temperature mapping is necessary because without it you have no idea which spots in your storage facility or shipment vehicle are most exposed to heat and most likely to cause a temperature excursion. You also have no basis for deciding where to place your data loggers, so excursions can happen in a corner nobody is watching and go completely unnoticed.
Mapping those unsafe spots matters because temperature sensitive products like vaccines, biologics, pharmaceuticals and blood products degrade once they move outside their labelled range. The damage is usually invisible, so a vial that has been sitting in a warm corner looks exactly like one that has not. These products are expensive and often not available on demand, so a single excursion can mean a written off batch and a supply gap you cannot fill quickly. Worse, if the excursion goes unnoticed, a degraded product reaches a patient who is relying on it to work. Here are the main reasons temperature mapping is essential in cold chain facilities and shipments.
Protects the products
Temperature Mapping finds zones that drift out of range, such as spots near doors, dead air corners that run warm or spots near cooling coils where stock can freeze. It identifies these spots where you can put a monitoring sensor or temperature data logger to catch excursions before they happen and prevent them.
Tells you where to monitor
A monitoring sensor or data logger at the wrong place can give false assurance that your products are within safe limits. Temperature mapping shows where breaches are likely to happen so your permanent sensors watch the spots where your products are likely to fail first.
Helps in regulatory compliance during audits
WHO, CDSCO, EU GDP and USP all call for mapping of temperature controlled storage and transit. WHO goes further and says an unmapped area is not safe to store product in at all. Later in the blog we have expanded how temperature mapping actually helps in compliance during audits and inspections.
Exposes equipment problems
Uneven readings point to blocked air outlets, weak insulation, failing door seals, or a refrigeration unit that cannot cope up when temperatures rise. By identifying equipment that fails regularly, temperature mapping exposes the gaps in your cold chain and prevents repetitive excursions.
Identifies power cuts
If the power supply drops during a temperature mapping study, the loggers record the whole event. You get the time it went, how long it stayed down, and how far the temperature climbed before it came back. Run it long enough and the pattern usually repeats, so you know exactly which window to watch your stock in.
Helps Utilise Available Space Efficiently
A thermal mapping study run without fixed acceptance criteria shows what a space is genuinely capable of holding. You can then zone the racking, keeping sensitive stock in the stable core and robust product in the marginal bays, instead of paying for more cold storage.
3. How does temperature mapping work?
A. In storage facilities
A storage facility is never one single temperature. The air near the cooling unit, the top rack, the bay beside the door and the corner where the airflow dies all behave differently, and your thermostat reports none of that. Temperature mapping measures the whole space so you know which spots are actually safe for your products and which are not. Without it, you are placing valuable stock and your monitoring sensors on assumption rather than data.
WHO breaks the thermal mapping process into four stages. Prepare a mapping protocol. Carry out the mapping exercise. Prepare a mapping report. Implement the recommendations. The steps below follow that flow.
1. Write and approve the temperature mapping protocol
The protocol is the temperature mapping plan. It describes the area, the reason for mapping, the scope, the objectives, the method and the template for the final temperature mapping report. It must be reviewed and approved by a responsible person in your organisation, before the study begins.
2. Survey the cold storage site
Record the length, width and height of each area. Draw the layout, including shelving and pallet racks. Mark where the cooling units, air outlets, fans, doors, existing monitoring sensors and thermostats are. These details decide where the loggers go.
3. Set the acceptance criteria
Define the allowed range based on the products you store. For example, 2 °C to 8 °C or 15 °C to 25 °C. If the thermal mapping study includes door openings, define how often and how long the door stays open. WHO says the temperature should return within limits no more than 30 minutes after a door opening.
4. Select and prepare the data loggers
Use one type of temperature data logger for the whole study. Each one needs a valid calibration certificate. WHO specifies a 3 point calibration with an error of no more than plus or minus 0.5 °C at each point. The calibration points should cover the range being studied: one below it, one in the middle and one above it.
5. Decide on the data logger positions
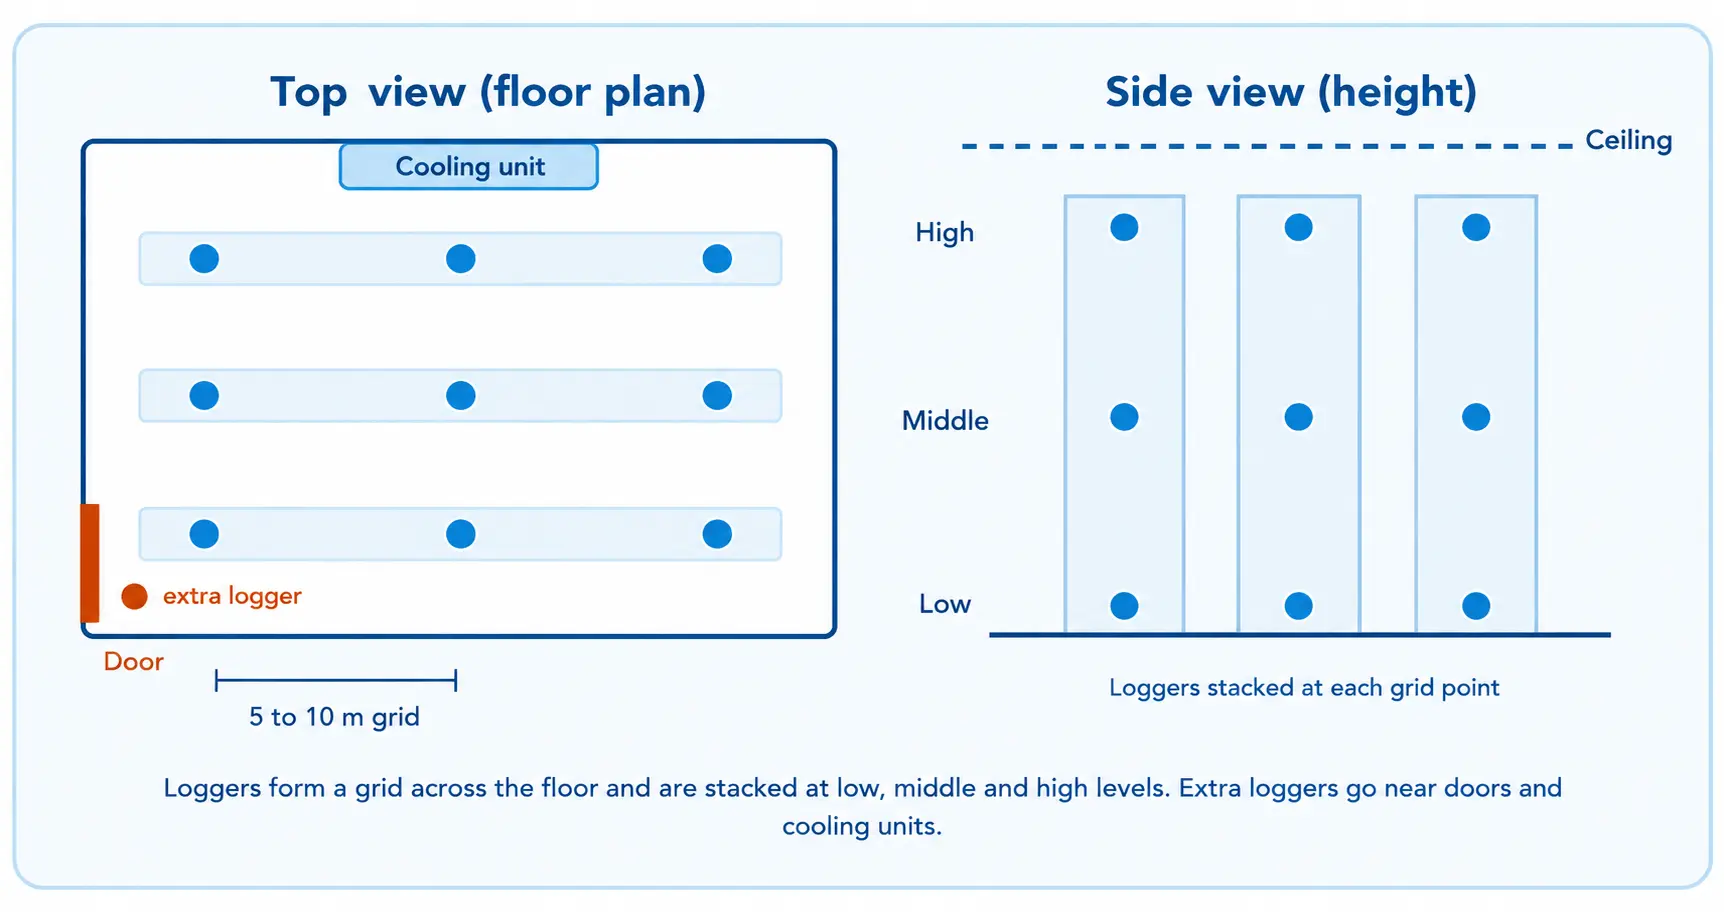
Place data loggers in a grid across the length and width of the area, usually every 5 to 10 metres. In very large facilities this spacing can stretch to 20 or 30 metres. Loggers are also stacked vertically at each grid point. See the table and diagram below.
6. Label, program and fix the loggers
Give every temperature data logger a unique location ID and note its serial number, so each reading traces back to a calibration certificate. Set the same recording interval on all units, typically between 1 and 15 minutes. Set the same start time on all units. Fix each logger firmly so it does not move during normal work, and let it settle to room temperature before recording starts.
7. Run the temperature mapping study
Brief the staff so nobody moves or switches off a logger. If door openings are not logged automatically, keep an access log. Record any power cuts. If the room has two refrigeration units, map it with each unit running on its own, because the temperature pattern can change depending on which unit is working.
8. Download and analyse the data
Collect every temperature data logger, check serial numbers against locations, and download the data. Find the minimum, maximum and mean temperature at each point. Identify the hot and cold spots. Look for patterns linked to doors, cooling cycles, time of day and day of week.
9. Prepare and review the report
The temperature mapping report explains the results, lists any deviations, and gives clear conclusions. A competent person who was not part of the study should audit and sign it.
10. Act on the findings
Move monitoring sensors and temperature data loggers to the hot and cold spots. Mark no storage zones. Adjust air outlets. Upgrade equipment if needed. Then remap if the changes were significant.
A new cold room is normally mapped empty first, as part of operational qualification (OQ) . It is then mapped again under a normal load, as part of performance qualification (PQ) . Product changes how air moves. A room that looks perfectly even when empty can develop warm pockets the moment pallets block the return air path.
B. For Shipments
Mapping a moving vehicle is harder than mapping a room. Outside temperature changes along the route. Doors open at every drop. The refrigeration unit may stop at checkposts or during overnight halts. WHO covers this in its supplement on qualification of refrigerated road vehicles, and describes the process as a temperature mapping exercise similar to the one used for fixed storage.
1. Static Mapping First
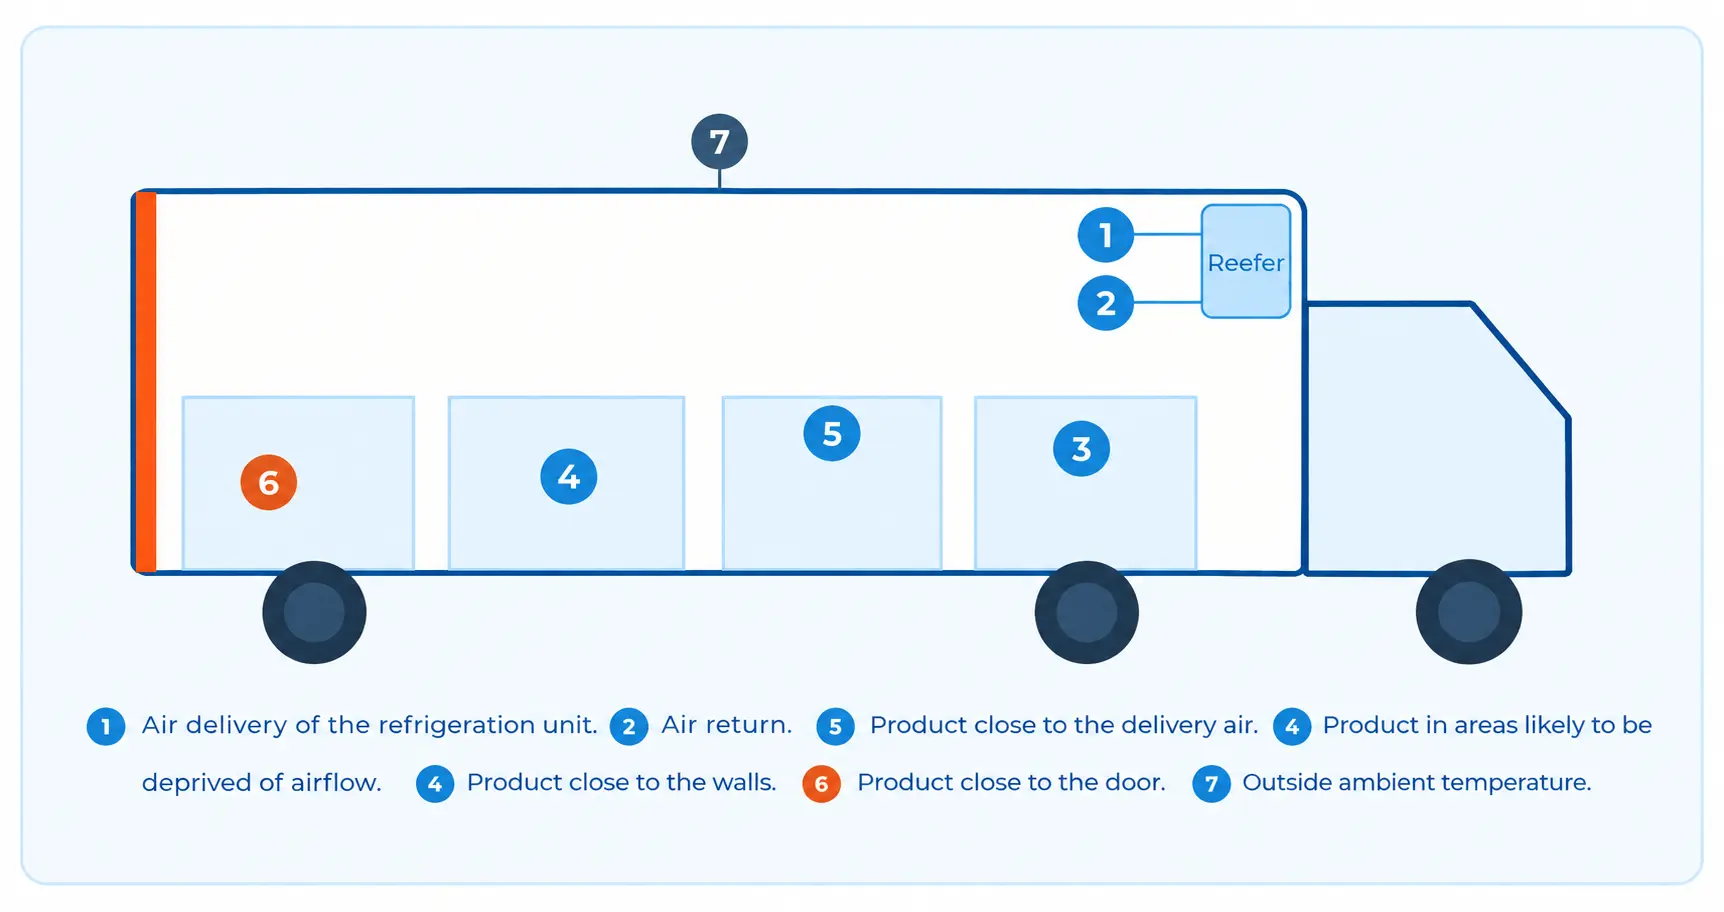
Before the vehicle goes anywhere, WHO recommends a static mapping exercise of the cargo compartment. This identifies the worst case positions, meaning the hottest and coldest spots inside the load space. Those positions then become the logger locations for the road tests.
2. Put the probes where the product is
For vehicle qualification, probes are fixed inside the packaging of the transported products, not left loose in the air. The reason is simple. Air temperature in a load compartment can spike briefly while the product itself stays comfortably in range, and it is the product you are protecting. WHO lists these minimum recording points.
Where the vehicle makes several drops, plan the probe positions around the unloading order. WHO requires that at least two probes, covering the hottest and coldest locations in the load compartment, stay attached to the payload right up to the final drop.
3. Run the road tests
A truck performs differently when it is loaded fully than it does when nearly empty. Similarly the vehicle performance also differs in peak summers and winters. Therefore, WHO sets a minimum of four tests to reflect the full range of the vehicle’s use.
| Test | Payload | Season | What it proves |
|---|---|---|---|
| Test A | Maximum payload | Warmest season | The unit can cope with a full load in peak heat |
| Test B | Minimum payload | Warmest season | Low thermal mass does not lead to overshoot or rapid warming |
| Test C | Maximum payload | Coldest season | No freezing risk at the delivery air end with a full load |
| Test D | Minimum payload | Coldest season | The worst case for cold damage in a lightly loaded compartment |
The route should reflect a realistic worst case. In practice that means multiple drop offs with the associated door openings, the shortest journey time between drops, and overnight stops on electric standby.
Because two seasons are involved, a vehicle cannot be fully qualified until both have passed, which can take up to six months. After the first pair of tests the vehicle is only provisionally qualified. Where a suitable test chamber is available, both seasons can be simulated in a static exercise instead.
These tests have strict acceptance. Product temperatures should stay within the required range for the entire route and across all four tests, allowing only for the plus or minus 0.5 °C accuracy of the devices themselves.
4. Temperature control failure test
This test answers one important question. If your vehicle breaks down, how long do you have before your products get damaged?
Most companies cannot answer this. The temperature control failure test gives you that number before you need it.
The test is done in a controlled way. The load compartment is preconditioned and the unit is set to the middle of the temperature range, so 5 °C for a 2 °C to 8 °C load. Setting it at the midpoint gives the product room to move in either direction before it breaches. The load is left to stabilise, which usually takes around 12 hours. The unit is then switched off.
The loggers keep recording after that. The test ends as soon as any single product reading crosses the upper or lower limit. That elapsed time is recorded in the qualification.
This number is useful in practical ways. It tells you how long a driver can wait for roadside assistance before the load has to be shifted to another vehicle. It tells your control room when to escalate instead of waiting further. It also helps you decide whether a backup vehicle should be sent immediately or whether there is enough time for a repair.
The same number applies to any loss of temperature control, not just a breakdown. It is equally relevant if the unit runs out of fuel, fails during an overnight halt, or is switched off at a checkpost.
Never use saleable product for a failure test
The load will be damaged, that is the point of the test. Use expired product that has been risk assessed and controlled so it cannot re-enter the market, a dummy load with similar thermal properties, mass and packaging, or empty boxes. Empty boxes represent the worst case because they carry the lowest thermal mass.
5. Profile the route your shipment will take
Before you qualify a vehicle or choose a box, you need to know what the route will actually do to your shipment. Route profiling is how you find that out. Temperature data loggers are sent along the real route to record ambient temperatures, transit times and delays, so you are designing around real conditions instead of assumptions. WHO covers this separately in its technical supplement on transport route profiling qualification.
On Indian lanes this matters more than most companies expect. This is where you learn how hot a container gets while parked at a toll plaza in May, how long a consignment sits at a border checkpost, and how much the temperature drops on a night run through the north in December.
That data then drives every decision that follows. It tells you whether you need an active reefer or a passive box, how much coolant the box needs, and how many hours of hold time you should be asking for. Skipping this step usually means over specifying the packaging to be safe, which costs more on every single shipment, or under specifying it and finding out the hard way.
4. Where should temperature mapping be done? In a storage facility or vehicle?
According to the guidance given by the World Health Organisation, temperature mapping should be done at every space which is used to store or handle products with a labelled storage temperature, both during fixed storage and shipment.
Cold rooms
Walk in rooms at 2 °C to 8 °C for vaccines, insulin and biologics.
Freezer rooms
Ranges such as minus 25 °C to minus 10 °C for frozen stock.
CRT warehouses
Controlled room temperature stores, usually 15 °C to 25 °C.
Receiving and loading bays
Short stay zones where doors open constantly and temperatures rise.
Quarantine and rejected areas
Stock awaiting QA release still needs the right temperature conditions.
Refrigerated Vehicles
Reefer trucks, vans and trailers for last mile and long haul.
Pharmacy and lab fridges
Shelf to shelf temperature variation inside a single fridge can be surprisingly wide.
Packing and staging areas
Where product sits outside controlled storage while orders are built.
Passive shippers and cold boxes
Qualified with the exact pack out and coolant setup you actually use
Small fridges and freezers sit in a slightly different category.
WHO notes that many of these units are independently tested and prequalified, so its storage area mapping supplement does not cover them. Most QA teams still map them as part of equipment qualification, because the difference between the top shelf and the crisper drawer of a pharmacy fridge is rarely small.
5. What is the role of a temperature data logger in mapping?
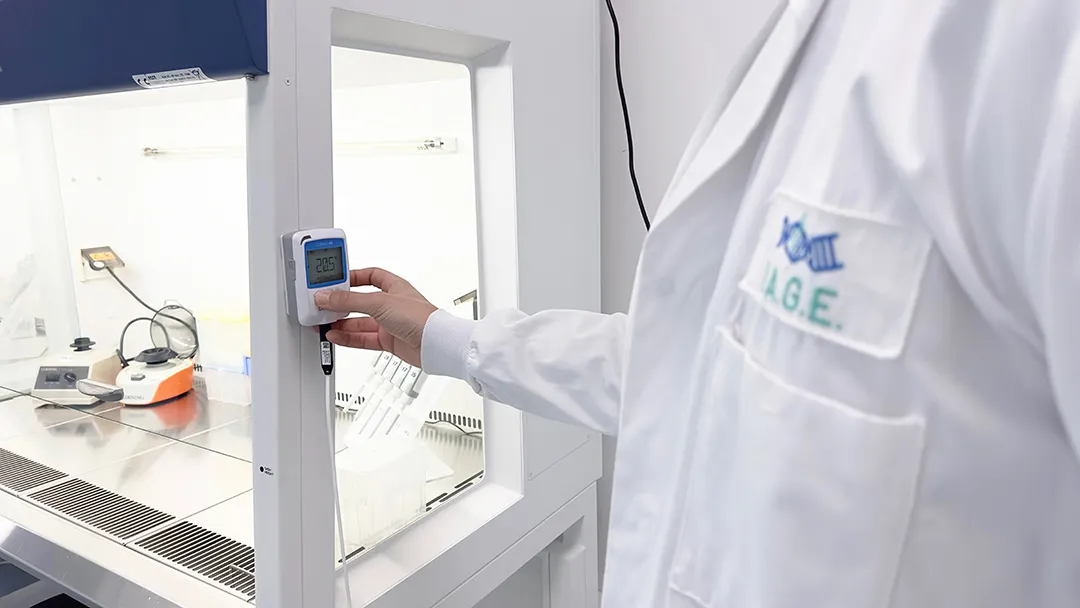
A temperature data logger is the cold chain equipment that makes monitoring possible. It is also called an electronic data logging monitor. It is a small standalone device that measures temperature with an electronic sensor and stores readings at a set interval, without needing the person or network connection to be present. In temperature mapping, a data logger performs the following:
Record the space point by point
A single thermostat shows the room temperature. Multiple synchronised temperature data logger devices describe the whole room. Because they start recording at the same time, the readings can be compared minute by minute.
Catch Unnoticed Excursions
A temperature data logger runs throughout nights, weekends and even when no staff is actually there to monitor. The 3am defrost cycle, the Sunday when the unit ran alone, and the loading bay door left open during unloading, everything is caught in the data logger.
Provide a traceable evidence
Each temperature data logger carries a serial number tied to a calibration certificate. That chain, from reading to device to certificate, is what makes the temperature mapping report acceptable to an auditor rather than just interesting internally. Each data logger also stores time stamped readings either in their internal memory or on the cloud platform according to the type which provides a clear audit trail for verification.
Gives actionable results for the monitoring system
Through the readings given by the temperature data loggers you can identify the hot and cold spots which gives you an idea of where exactly excursions are likely to happen and where you should place your temperature sensors or data loggers. This helps you decide where exactly the permanent monitoring system should be placed in the facility or shipment vehicle.
6. How should you select the right data logger for temperature mapping?
The accuracy and quality of your temperature mapping study depends on your temperature data loggers. If the devices are wrong, the data is wrong, and no amount of careful analysis afterwards can fix it. WHO sets out clear criteria for selecting the right data logger. During audits, an auditor is expected to check all of them.
a. A measuring range that covers all extremes
The temperature data logger must be able to record temperature in the range the space actually reaches not in the range you would expect the space to reach. A logger that tops out at 40 °C is useless in a loading bay in May, because it will simply stop reporting at its ceiling and you will never know how high it really went. WHO suggests a range like minus 30 °C to plus 60 °C for general purpose work.
b. Programmable recording interval
You need to be able to set the monitoring interval yourself, anywhere between 1 and 15 minutes, and set the same value on every device. A temperature data logger with a fixed interval you cannot change will not fit every study.
c. Enough memory for the full study
Check the data logger memory before choosing it. It should have enough internal memory to store all the readings. The more shorter the monitoring intervals, more memory gets filled. On the cloud platform the memory is unlimited. Check for offline data loggers like Tempmate M2 with a large internal memory of 60,000 readings.
d. Valid 3-point calibration certificate
This is what auditors check first. WHO requires an NIST traceable calibration certificate with a guaranteed error of plus and minus five 0.5 °C at each point, valid within the current year. The three calibration points should bracket your range, meaning one below it, one in the middle and one above it. A certificate calibrated at 0 °C, 25 °C and 50 °C proves nothing about a logger being used in a freezer room.
e. Unique serial number on every unit
Every logger needs its own serial number, and that number has to run through the whole study. It goes on the location table next to the logger ID, so the device sitting at position DL-014 on the top rack is recorded as a specific physical unit. It appears on the calibration certificate filed in the report annexe. And it comes through on the downloaded data file.
That chain is what makes the study evidence rather than just readings. An auditor picks one line from your results table, follows the serial number to the certificate, and confirms that particular device was accurate on those dates. If the readings cannot be traced back to a specific calibrated unit, there is no proof the numbers are correct, and the report will not hold up.
It also protects you during the thermal mapping study itself. When you collect the loggers at the end, you check the serial numbers against the location table before downloading. If one has been moved or swapped, you find out then, instead of publishing a report that says a reading came from the door bay when it actually came from the middle of the room.
f. Easy to download and compare
The whole point of temperature mapping is comparing temperature data loggers against each other, so the readings need to come off the devices and into one place for consolidated analysis. In cloud connected data loggers, the readings are stored in the cloud platform, a single place where they can be compared, in offline USB models, the readings can be retrieved by attaching the data logger to a laptop or computer device through a USB port. You can download time stamped audit ready PDF/CSV reports which can be placed during audits and inspections.
g. Choose one data logger type across the entire facility
WHO asks for a single type of data logger device per temperature mapping study, and it is worth following.
The reason is that a temperature mapping study works by comparison. You are not reading absolute numbers, you are asking why the logger on the top rack reads warmer than the one by the door. That comparison only holds if every device would give the same reading when placed side by side.
Different data logger models break that. Each has its own tolerance band, its own sensor response time, and its own sensor position inside the casing. Two models sitting in the same spot can differ by half a degree, and one may react to a door opening a few minutes later than the other. Put them in different corners of a warehouse and you can no longer tell whether a difference in the data is the room or the device.
That matters most at the exact points you care about. If your hot spot shows a 0.6 °C difference from its neighbour, you need to know that came from the airflow, not from a different model with a wider tolerance. Otherwise you could end up relocating sensors, marking a bay as unusable, or ordering remedial work based on a difference the equipment invented.
Practically, order the full set from one licensed supplier like Lisaline Asia in one lot, calibrate them together, and keep a few spares of the same model in case one fails mid study. Swapping in a different model halfway through means either redoing that position or explaining the mismatch to an auditor later.
h. Data logger that meets data integrity rules
Choose cold chain equipment with software that meets data integrity rules like 21 FDA CFR Part 11, covering audit trails, user access control, and protection against records being altered.
i. Physical Size and Mounting
A temperature data logger must sit where the products sit, sometimes on a high rack or inside a packed palleted bay. A compact temperature data logger device with a clip or a bracket is far easier to position accurately and far less likely to get knocked out of place during the week.
j. Battery life
You should choose a data logger with a long reasonable battery life that covers both conditioning period before the thermal mapping study and the mapping study period itself. A short battery life that dies after a few hours or days costs you the whole logger position.
k. Humidity mapping along with temperature
Many pharmaceutical and sensitive products carry humidity limits along with temperature. If your products also carry those limits then use combined temperature and humidity data loggers and capture both in the same study so that you do not have to conduct another temperature mapping study just for humidity.
7. Which data loggers should you choose for temperature mapping?
Knowing the criteria is only half the job. The other half is finding a data logger that meets them. Lisaline Asia supplies data loggers from Dickson and Tempmate, along with its own Degrite S. It also runs a NABL accredited, ISO 17025 certified calibration lab in India. Here is how each model compares with what WHO asks for and what an auditor will check.
Cloud connected data loggers
Every temperature data logger in this category reports to one OCEAView dashboard with a full audit trail.
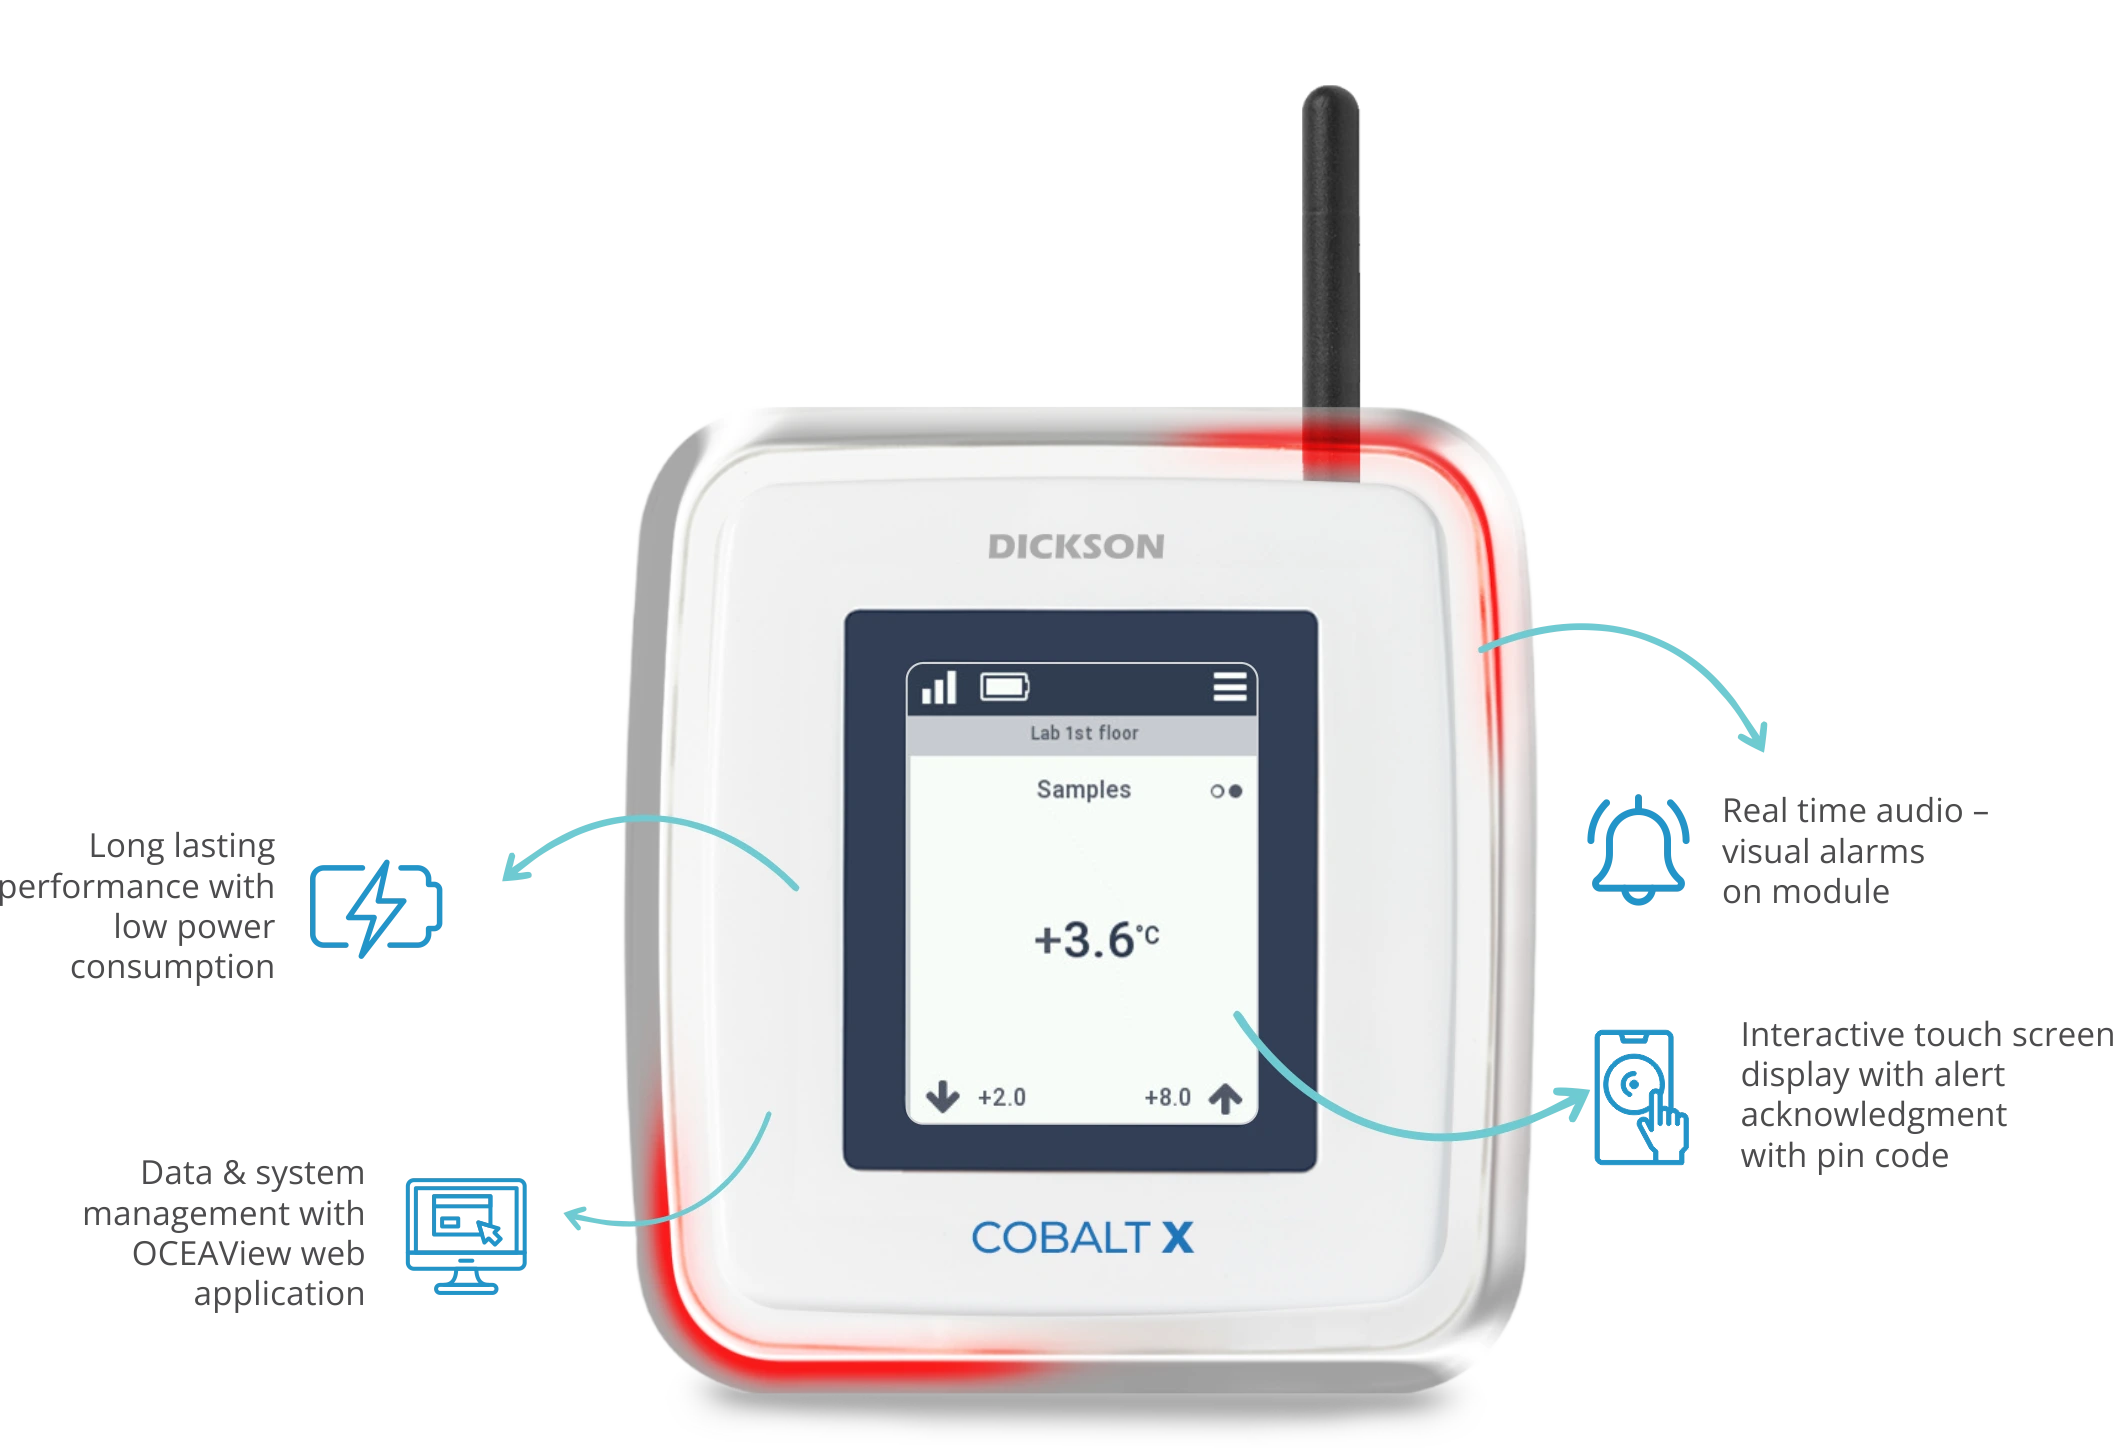
Cobalt X1 and X2
Best for cold rooms, labs and warehouses that will move to permanent monitoring.
Cobalt X connects up to four sensors at once, wired or wireless. It can measure temperature, humidity, CO2, differential pressure and more. Readings travel over LoRaWAN to a gateway and then to the OCEAView cloud platform. Every logger in the study appears on one dashboard, with graphs, reports and a full audit trail.
For regulated pharma and lab spaces, choose the X2, which is 21 CFR Part 11 ready. Each logger keeps readings in its own memory, so data is safe if the connection drops. It runs on batteries or AC power, so battery life is not a concern for long studies.
The Smart Sensors store their own calibration data. When a sensor is due for calibration, you swap it out and the logger keeps working.
Accuracy depends on the sensor you fit. Ask for the sensor datasheet and confirm it holds ±0.5 °C across your full range.
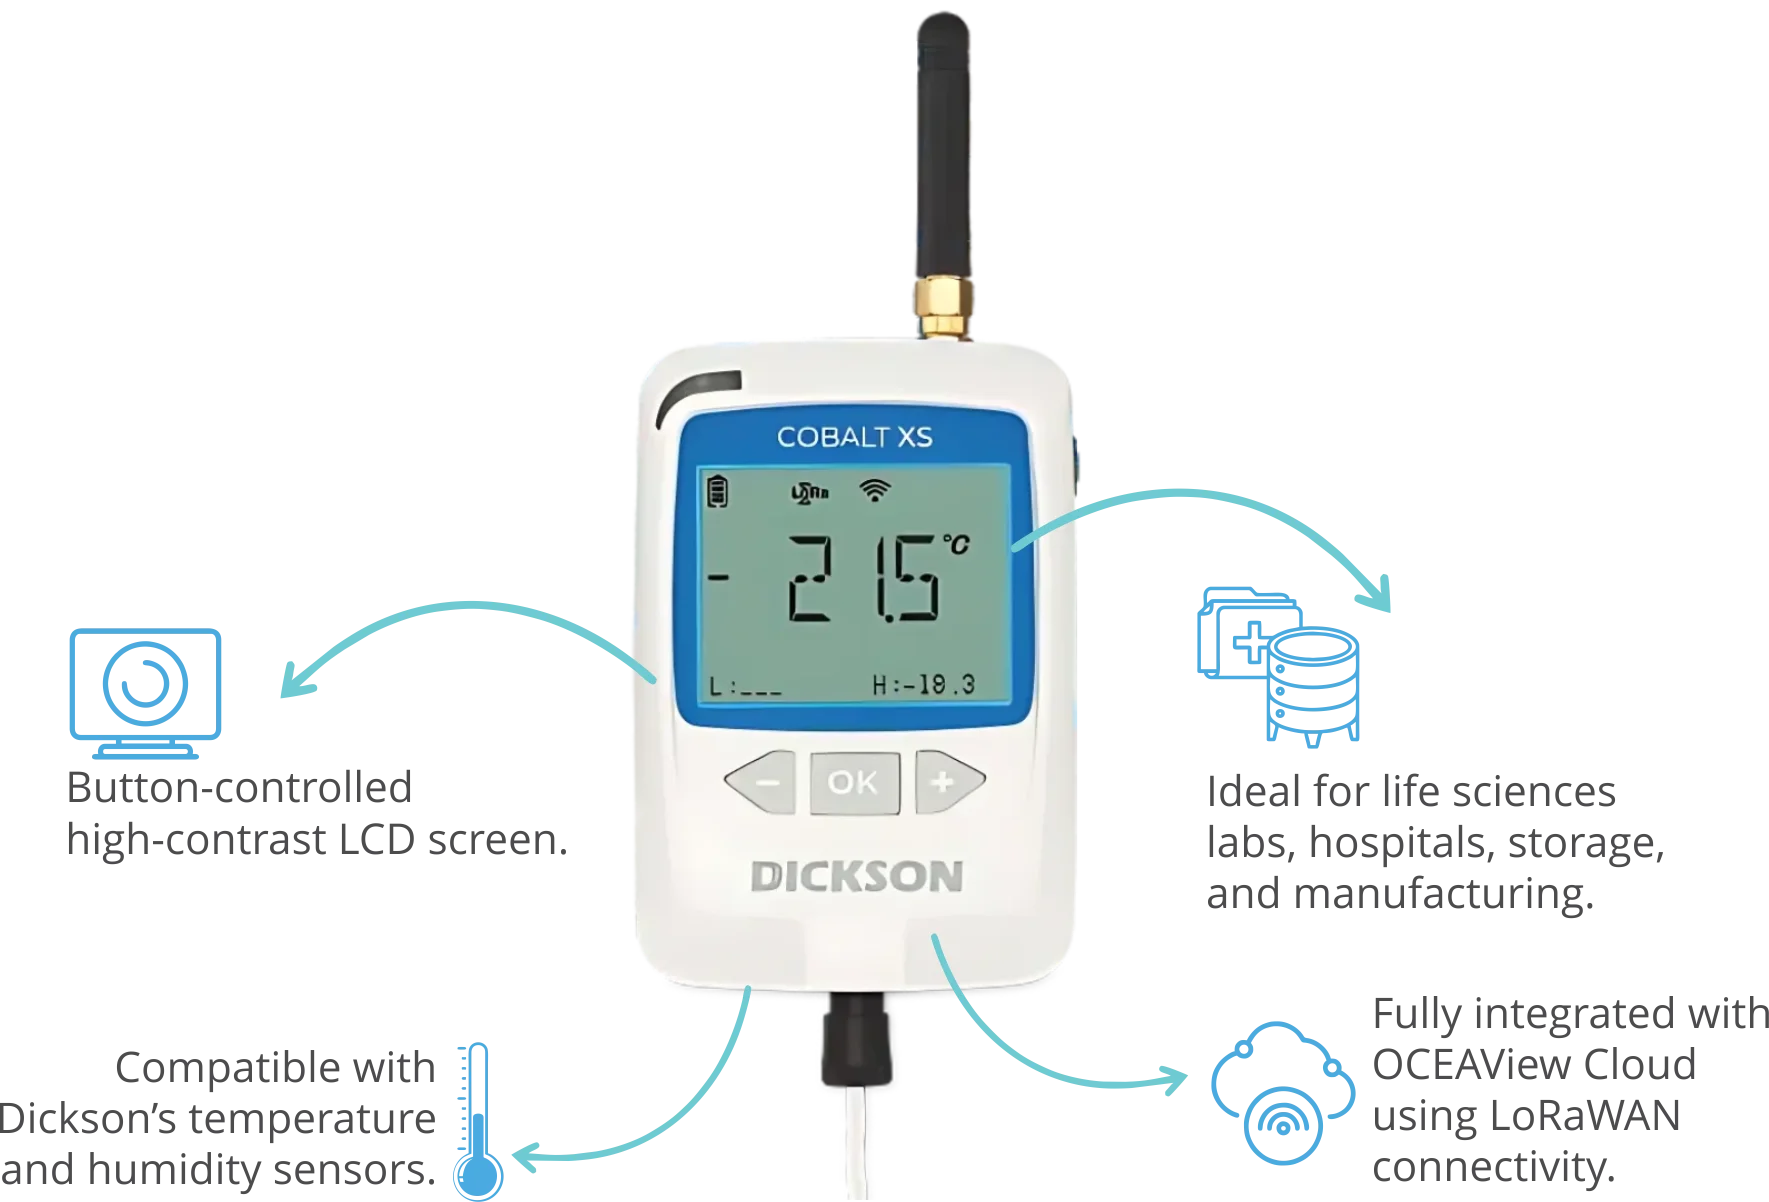
Cobalt XS
Best for large sites that need long range coverage at a lower cost.
Cobalt XS takes one external probe. That can be a digital temperature sensor, a Smart Sensor Pt100 for high accuracy, or a dual temperature and humidity sensor. So one device covers humidity mapping too.
The standard range is 0 °C to plus 50 °C. With the optional IP67 protective casing, it goes down to minus 30 °C. The internal memory holds about four weeks of readings at a 10 minute interval, and the readings sync to OCEAView so the whole study sits in one place making it 21 FDA CFR Part 11 ready.
Each XS is added to OCEAView using its serial number. This links every reading in the platform to one physical unit, which is exactly the chain an auditor follows. The battery lasts at least a year, which easily covers both the conditioning period and the study.
Cobalt XS Wifi
Best for facilities with good Wi-Fi that want the simplest setup.
Cobalt XS Wifi sends data over your site’s existing Wi-Fi, so no gateway is needed. It monitors up to two measurement points for temperature and humidity. If the Wi-Fi drops, readings stay in the logger and upload once the connection returns. No gaps show up in your study.
Calibration is where this model stands out. Every unit ships with a traceable calibration certificate from a COFRAC accredited ISO 17025 lab. ISO 17025 accredited and NIST traceable options are both available, and recalibration is a simple sensor swap.
The logger is compact and mounts on a wall cradle with magnets, or with screws or Velcro. Reports download as PDF or CSV from OCEAView, which keeps a full audit trail for 21 CFR Part 11 and GxP.
Dimensions: 69 x 107 x 31mm and is lightweight with 130g weight.
Bluetooth Data loggers
Bluetooth data loggers are small and compact enough to fit into tight spaces. The data is collected in one web platform.
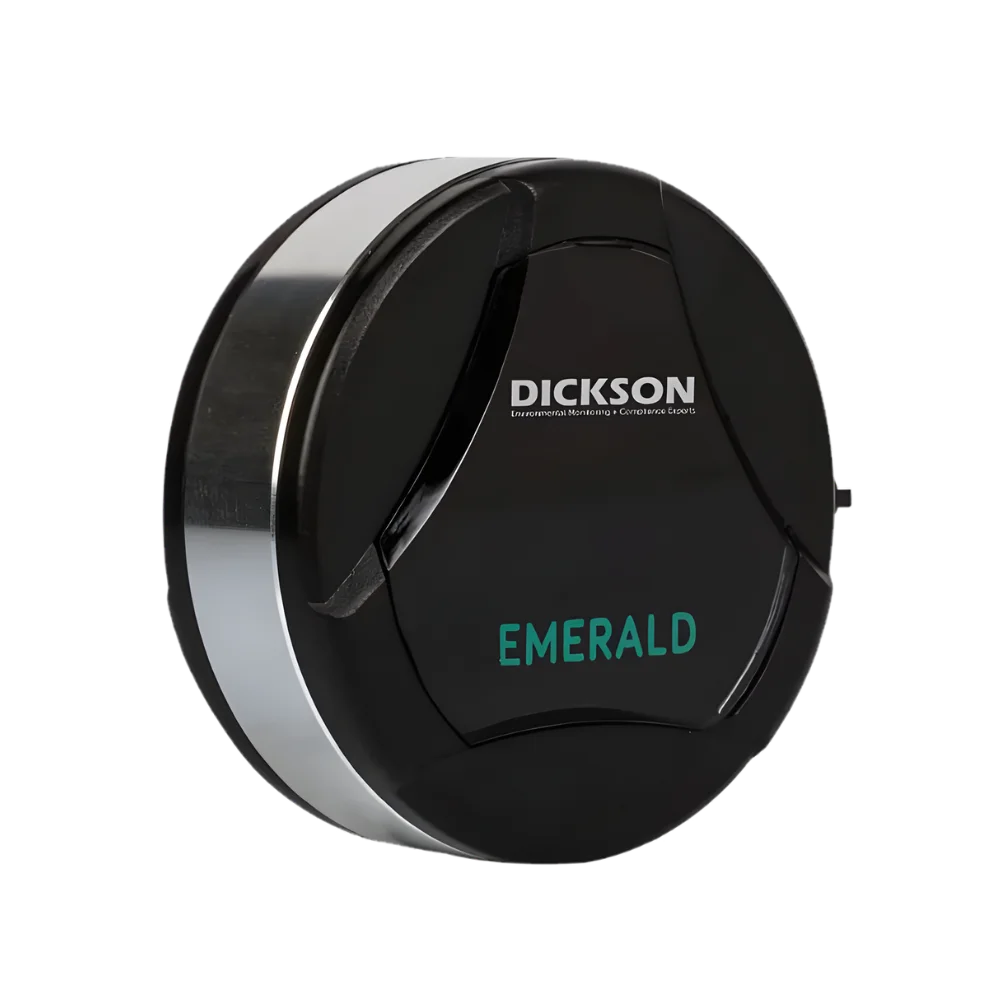
Emerald
Best for dense logger grids and extreme temperature spaces.
Emerald fits inside almost any rack, box or compartment. That makes it easy to build a dense grid in a packed warehouse. The internal sensor covers minus 40 °C to plus 85 °C. For extreme spaces, the external Pt100 versions go down to minus 200 °C or up to plus 200 °C.
Data syncs to OCEAView through the mobile app or through the DICKSONBridge gateway. The Bridge picks up readings automatically within about 50 metres, so you do not have to walk the floor with a phone. Reports download as PDF, Excel or CSV.
Dickson’s lab offers ISO/IEC 17025 (COFRAC) accredited calibration. The casing is shock resistant, and together with OCEAView, Emerald meets 21 CFR Part 11.
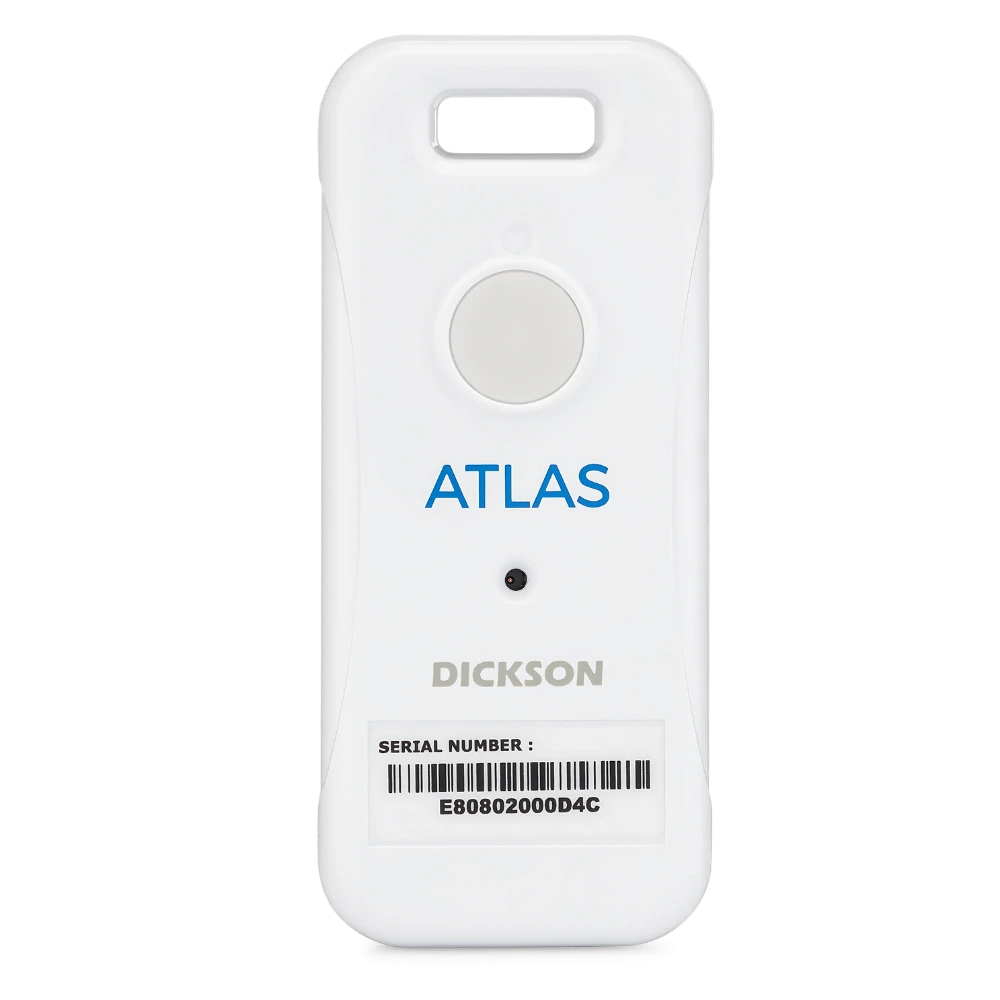
Atlas
Best for large studies that need identical settings on every logger.
Atlas measures temperature and relative humidity, so one device covers both in the same study. It reads minus 30 °C to plus 70 °C with ±0.5 °C accuracy and stores 16,000 readings.
It supports immediate, delayed or programmed start. This helps with temperature mapping, because you can set every logger to start recording at the same minute. With NFC programming on DICKSONBench, you can configure a large batch quickly with identical settings.
Each bluetooth logger unit can be reused for at least a year. Data comes into one web platform, where you can download PDF, Excel or CSV reports.
USB Data Loggers
USB data loggers need no network. Plug them into a computer and you can get time stamped PDF/CSV reports.
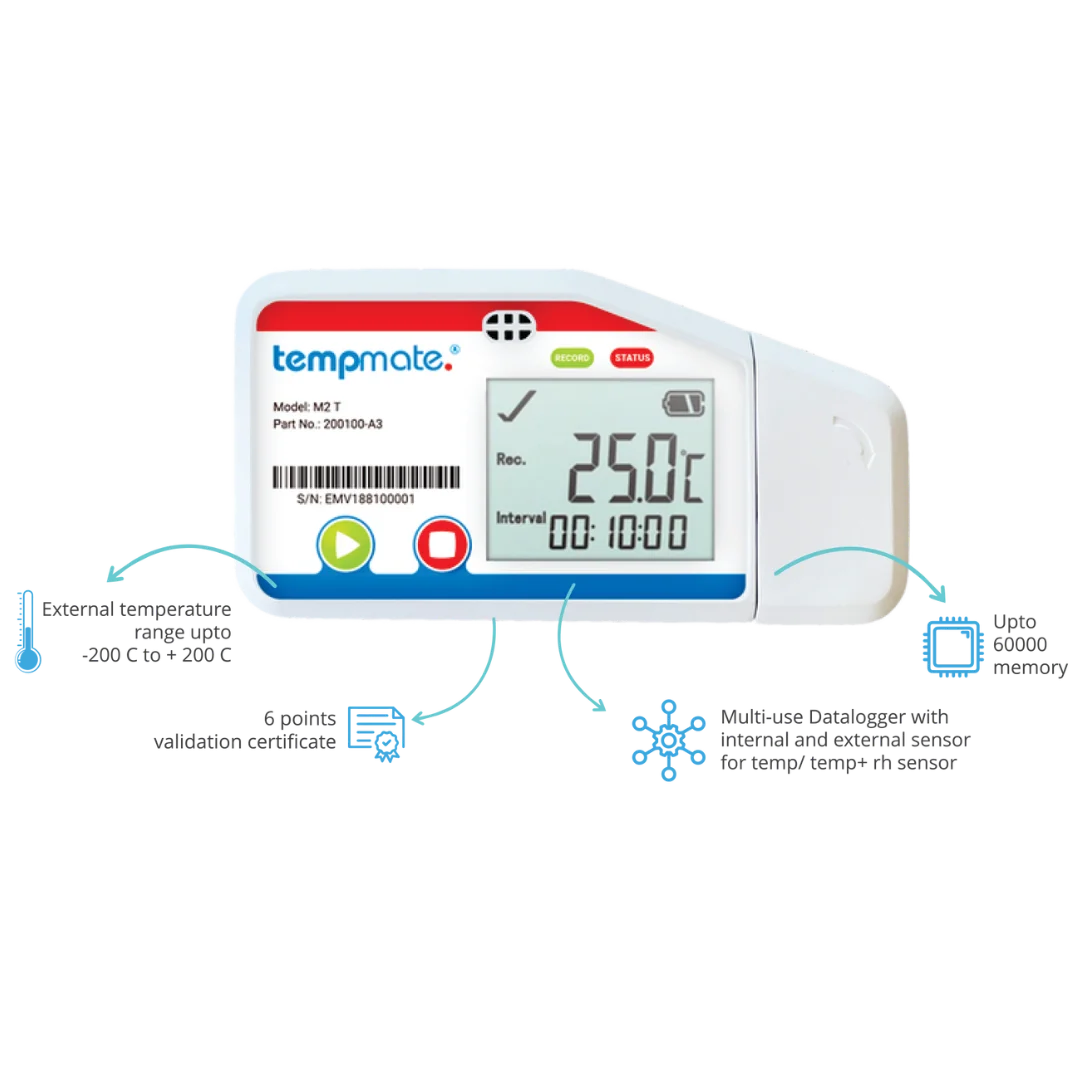
Tempmate M2
Best for offline studies that need the highest accuracy and humidity data.
Tempmate M2 is the most accurate offline option. It reads temperature with ±0.3 °C accuracy and relative humidity with ±3% accuracy. It stores 60,000 readings, so short intervals over a full week are not a problem. You can add up to three external probes to cover wider ranges.
Each unit comes with a 6 point validation certificate, which covers more points than the 3 that WHO asks for. The M2 is EN 12830 and GDP compliant. It has password protection and backlog recovery, and it produces PDF and CSV reports over USB without any software.
The certificate is valid for 2 years from production. WHO wants proof of calibration within the current year, so get older units recalibrated at Lisaline’s lab before the study.
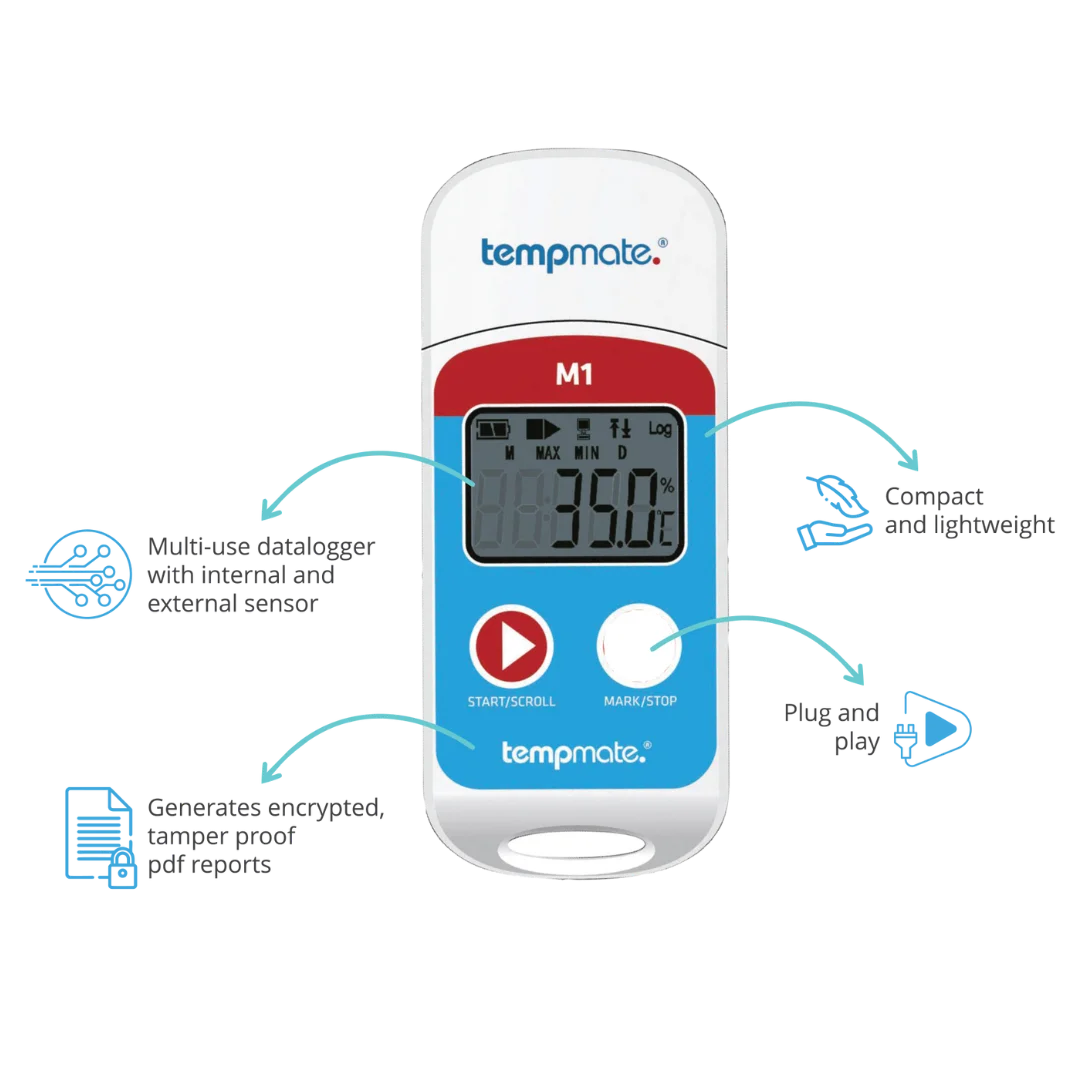
Tempmate M1
Best for ambient warehouses and controlled room temperature stores.
Tempmate M1 is a reusable temperature only logger with ±0.5 °C accuracy. It reads minus 20 °C to plus 40 °C. The interval can be set anywhere from 10 seconds to 24 hours, and it stores 32,000 readings.
Each unit carries its own 6 point validation certificate. It generates PDF reports over USB, and you can compare data from several units in the free tempbase software.
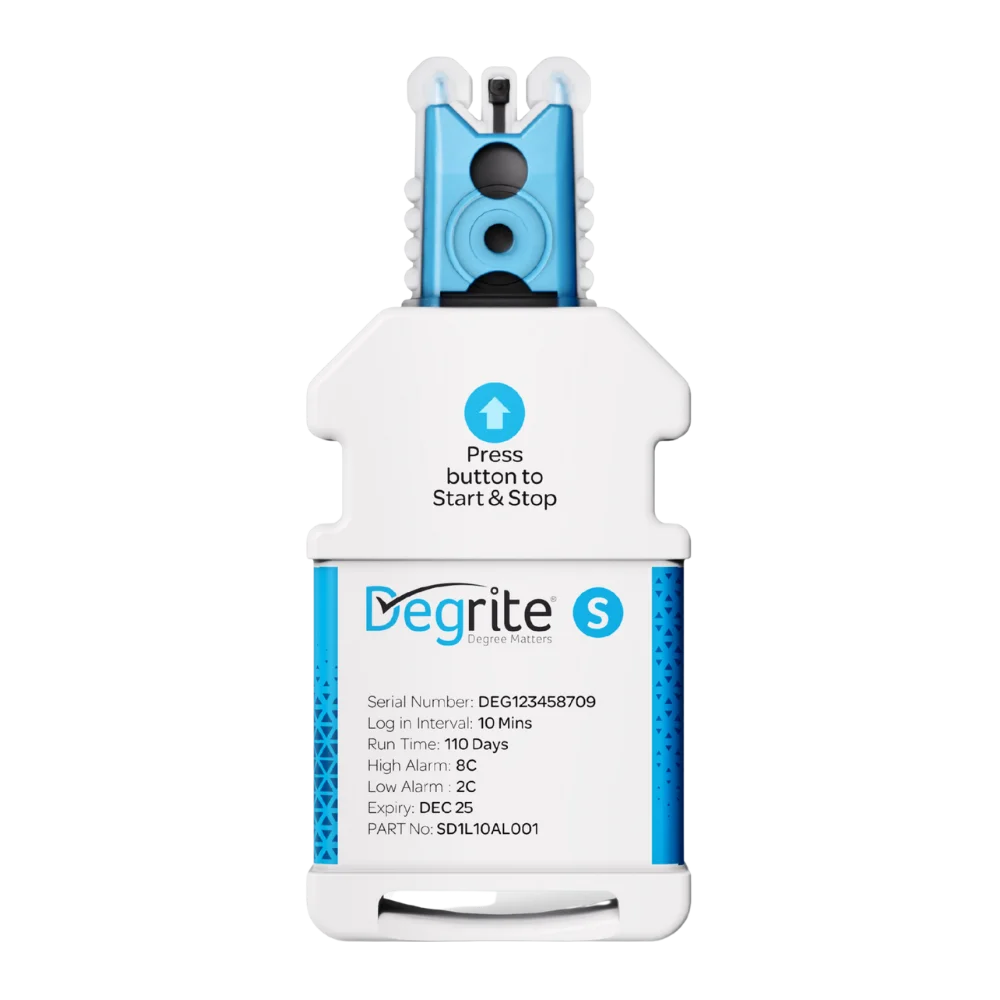
Degrite S
Best for one time studies that need many identical loggers.
Degrite S is Lisaline’s own USB data logger, designed in Germany and made in India. It reads minus 30 °C to plus 70 °C with ±0.5 °C accuracy and 0.1 °C resolution. It records for up to 110 days at a 5 minute interval, and the interval, alarms and delay are configured to your order.
It comes with a traceable calibration certificate, and you can access the validation certificate from the logger’s memory or online. You can order packs from 10 up to 500 units, all with the same configuration. That makes it easy to follow the WHO advice of using one logger type across the whole facility.
It is IP67 rated, EN 12830 and GDP compliant. Backlog recovery protects the record if the battery drains mid study.
Quick comparison
| Model | Range | Accuracy | Memory | Humidity | Where the data lives |
|---|---|---|---|---|---|
| Cobalt X1/X2 | Sensor dependent | Sensor dependent | 4,000 per point + cloud | Yes | OCEAView |
| Cobalt XS | 0 to +50 °C (−30 °C with casing) | Sensor dependent | 4,000 per sensor + cloud | Yes | OCEAView |
| Cobalt XS Wifi | Sensor dependent | Sensor dependent | 32,000 per sensor + unlimited cloud | Yes | OCEAView / DicksonOne |
| Emerald | −40 to +85 °C | ±0.3 to 0.5 °C | 16,000 + cloud | No | OCEAView |
| Atlas | −30 to +70 °C | ±0.5 °C | 16,000 + cloud | Yes | Web platform |
| Tempmate M2 | −30 to +70 °C | ±0.3 °C, ±3% RH | 60,000 | Yes | USB PDF / CSV |
| Tempmate M1 | −20 to +40 °C | ±0.5 °C | 32,000 | No | USB PDF, tempbase |
| Degrite S | −30 to +70 °C | ±0.5 °C | 110 days at 5 min | No | USB PDF / CSV |
Cobalt X1/X2
OCEAViewCobalt XS
OCEAView(−30 °C with casing)
Cobalt XS Wifi
Wi-FiEmerald
OCEAViewAtlas
Web platformTempmate M2
USBTempmate M1
USBDegrite S
USBComparison based on available model specifications. Specifications may vary by sensor configuration.
7. Which data loggers should you choose for temperature mapping?
At Lisaline Asia the usual combination is compact USB data loggers such as Degrite S for the mapping grid, a wireless datalogging system such as Dickson Cobalt X for permanent monitoring at the identified spots, and GSM data loggers or shipment loggers with display for consignments in transit.
8. Temperature Mapping in Indian Conditions: What really changes on the ground?
In India, there is particular pressure on cold chain storage and monitoring equipment. A temperature mapping plan copied from a European template will miss it all. Hence you need to conduct temperature mapping in a way suitable for Indian storage conditions.
Conduct temperature mapping in both seasons
The Indian summer April-June is the hottest period in the year. This is when ambient warehouses, loading bays and parked vehicles are all tested hard. A thermal mapping study runs only during the winter proves nothing about the temperatures your equipment and products will experience in summer. You also need to conduct thermal mapping in winter because while you look at heat as the enemy, a cold spot might be quietly freezing your stock. Temperature mapping in both seasons catches both.
Frequent Power Interruptions
Outages remain routine, and not only in smaller towns. Delhi’s own distribution companies log tens of feeder level interruptions every day. A power failure test tells you how many minutes your room holds before stock is at risk. That figure decides your generator sizing and your escalation window, and it belongs in your SOP rather than in someone’s memory.
Long and unpredictable shipment routes
Interstate trips bring toll queues, checkposts, transit delays and overnight halts. A truck stationary in the sun for two hours behaves nothing like a truck in motion. Route profiling and seasonal vehicle testing matter more here than the guidelines alone suggest.
Mixed facility layouts
Many Indian distributors run cold rooms and CRT stores side by side with a shared loading bay. Every thermally separate area needs its own temperature mapping study, and the bay is usually the weakest link because the doors open constantly.
Last mile is where the chain breaks
The central cold room is usually the best controlled part of the chain. It has a validated cold room, a monitoring system, and someone responsible for it. The last mile has none of that. Stock moves into a district store, then a clinic, a stockist or a small hospital pharmacy, and the control drops at every step.
Monsoon humidity can affect your products
India is treated as ICH Zone IVb for stability testing, at 30 °C and 75 percent relative humidity. That is a deliberately harsh benchmark and it reflects real conditions here. If your products carry humidity limits, map relative humidity in the same study. There are temperature data loggers which also offer humidity monitoring.
9. What does a temperature mapping report contain?
A temperature mapping report is the actionable conclusion that the temperature mapping study provides. It is the deliverable that the study produces.
It is what the auditor reads, what your QA team signs and what your customers sign for. WHO sets out a clear structure for a temperature mapping report.
01. Introduction
A description of the objectives of the study, what was mapped and why.
The area, its dimensions, the temperature range it is meant to hold, and the reason the study was carried out.
The reason matters a lot. A study run for a new cold room before handover is a different exercise from one run after the refrigeration unit was replaced.
02. Summary
This is the main body. It discusses the results in the same sequence the protocol laid out, so anyone can follow the report against the plan it was based on.
It also lists any deviations, meaning anything that went outside the acceptance criteria, along with what happened and when.
If the study included door opening tests or a power failure test, those results appear here too.
03 Results for every logger position
For each location, the report records the minimum, the maximum and the mean temperature over the study, with a yes or no against the acceptance criteria.
Read the means alongside the extremes. A single spike tells you less than a location that sits consistently high.
A logger that touched 8.2 °C once during a door opening is a different problem from one that averaged 7.8 °C all week. Both need attention, but the fix is not the same.
04. Identifying the hot spots and cold spots
Stated clearly, with their exact locations marked on the layout drawing.
This is the finding that changes what you do next, because these are the points where your permanent monitoring sensors and temperature data loggers should be installed.
If the study covered two seasons, the hot and cold spots are stated for each. They can shift between summer and winter.
05. Conclusions and recommendations
The conclusion of a temperature mapping study report provides is a clear statement on whether the space is acceptable for storing your products, followed by what needs to be done about it.
Recommendations usually cover where to place monitoring sensors, which zones should not be used for storage, and what remedial work the data points to.
Auditors read this section first, so it should be written plainly rather than buried in technical language.
06. The annexes
This is where the supporting evidence sits. It is usually thicker than the report itself.
- The site survey drawing showing every logger position with its unique ID
- Raw data in the test data sheet format set out in the protocol
- Spreadsheet data and a temperature graph for every logger used
- Full results of the analysis, including how the hot and cold spots were determined
- Notes prepared during the study, including the access log and any record of power cuts
- Deviation reports and CAPA forms where required
- Calibration certificates for every logger used
The calibration certificates are the part most often missing. Without them the readings cannot be tied to proof of accuracy, and the report loses its value no matter how well the study was run.
A temperature mapping report should lead you somewhere
WHO clearly states that the outcome of a temperature mapping report should be actionable. The final outcome and purpose of a thermal mapping exercise is the implementation of the recommendations. That can mean a zoning drawing showing where product may be stored, pallet bay allocation in the warehouse management system, repositioned monitoring sensors, adjusted air outlets, mechanical upgrades, or a decision that the space is not suitable for storing sensitive products at all.
11. Which guidelines and standards apply to temperature mapping?
Different bodies like the WHO, CDSCO, EU GDP, etc have given a set of guidelines for how temperature mapping should be conducted in your storage facility or shipment vehicle. These guidelines broadly agree with each other so it is best to follow each of them to get the best results from your temperature mapping study.
WHO
WHO’s Technical Report covers the temperature mapping of storage areas. Its core requirement is that all new temperature controlled storage areas must be temperature mapped as a part of full document verification process before installation of cold chain monitoring equipment is commissioned and handed over. It is not safe to store time and temperature sensitive products- pharmaceuticals, vaccines or other products until temperature monitoring is done.
The temperature mapping procedures should demonstrate the air temperature profile throughout the area when empty and in a normal loaded condition. It should define zones that should not be used for storage such as areas close to cooling coils
or heat sources, and where required, demonstrate the time taken for temperatures to exceed the designated limits during a power failure.
Related supplements cover qualification of temperature controlled storage areas, qualification of refrigerated road vehicles, transport route profiling, and checking the accuracy of temperature control and monitoring devices.
CDSCO, India
The CDSCO Guidelines on Good Distribution Practices state that storage areas should be temperature mapped under representative conditions and temperature mapping shall show uniformity of temperature across the storage facility. The study should determine where temperature monitors should be located in areas likely to show the most fluctuations.
The CDSCO guidelines also requires cold chain monitoring equipment to be calibrated at defined intervals. It requires the monitoring records to be kept atleast one year or soner depending on product criticality. The guidelines also mention written procedures to be in place for temperature mapping.
This document is draft guidance prepared in line with WHO’s technical report series, so treat it as the direction of travel for Indian regulation rather than settled statute. CDSCO has separate published guidelines on good distribution practices for biological products.
EU GDP
The EU guidelines for good distribution practices require an initial temperature mapping exercise to be carried out on the storage area before use, under representative conditions. Monitoring equipment should then be located according to the results of that mapping, positioned in the areas that experience the extremes of fluctuations. The temperature mapping exercise should be repeated according to the results of a risk assessment, or whenever significant modifications are made to the facility or the temperature controlling equipment.
For transport, thetemperature monitoring equipment used within storage vehicles and containers should be maintained and calibrated at least once a year.
The guidelines also state temperature mapping shouldbe performed under representative conditions, taking seasonal variation into account.
Other Standards You Will See Quoted
WHO, CDSCO and EU GDP set the expectation to map. A second layer of standards governs how the measurement itself is done, and these are the ones an auditor turns to when checking your instruments rather than your process.
Temperature controlled distribution
Guidance on maintaining the quality of temperature sensitive medicinal products through the transportation environment. WHO cites it directly in its own supplements, and it is the reference most often used to justify how transport qualification was designed.
Competence of calibration laboratories
The standard your calibration laboratory should be accredited to. It covers technical competence, measurement traceability and uncertainty. An unaccredited certificate carries no weight in an audit, however official the paperwork looks.
Prequalified cold chain devices
The performance, quality and safety catalogue for cold chain equipment, including data loggers. It is where the plus or minus 0.5 °C accuracy specification for logging devices comes from, and it is useful when comparing devices during procurement.
Recorders and periodic verification
European standards for temperature recorders used in transport and storage, and for their periodic verification. WHO cites both in its guidance on qualifying refrigerated road vehicles, so they come up in vehicle qualification work.
What This Means for Your Data Loggers
All of this comes down to one practical requirement. Every logger used in a mapping study needs a valid calibration certificate behind it, and that certificate needs to come from the right kind of laboratory.
- A 3 point calibration certificate. Not single point. The three points should bracket the range you are studying, with one below it, one in the middle and one above it.
- Accuracy within plus or minus 0.5 °C at each point. This is the WHO requirement, and it applies at every calibration point, not just the middle one.
- Calibration from an ISO/IEC 17025 accredited laboratory. In India that accreditation is granted by NABL, the National Accreditation Board for Testing and Calibration Laboratories.
- Current validity. The certificate must be valid on the dates the study was actually run, not merely at some point in the past.
- Traceable to the individual device. Each certificate is tied to a serial number, and that serial number appears in your logger location table and your report.
Lisaline Asia operates an in house ISO 17025 lab and offers both in lab and on site calibration, so your full set of loggers can be certified together before the study begins and the certificates filed straight into the mapping report.
14. Common temperature mapping mistakes and how to avoid them?
Most temperature mapping studies fail or are rejected when placed before auditors due to the following reasons:
1. Mapping only the empty room:
Loaded pallets change how air moves. A room that passes the temperature mapping study when empty can fail once it is full, because stock blocks the return air path and creates warm pockets that were not there before.
This is why WHO asks for both conditions. The empty study is carried out as part of operational qualification and shows how the equipment performs on its own. The loaded study follows as part of performance qualification and shows how the space behaves under real working conditions.
Run only the empty study and your results will not reflect how the room is actually used. Run only the loaded study and you will not know whether a problem comes from the refrigeration system or from the way stock is arranged.
2. Different Start Times Across Loggers
The readings should be synchronised across devices. This means that all the data loggers for mapping should have the same start and end times. If they are not synchronised then the study loses its point by point comparision.
3. Mixing data logger models in one study
WHO states that you should use one data logger device type across the study. Every device has its own accuracy and calibration so mixing device would affect the accuracy of the study. It introduces variation that you cannot separate from the room’s behaviour.
4. Expired or missing calibration certificates
This is one of the most common audit findings. Every data logger used in the study needs a valid calibration certificate from an ISO/IEC 17025 accredited lab, traceable to national standards. The certificate must match the logger’s serial number, cover the study’s temperature range, and be current on the study dates. All certificates should be attached to the final report.
5. Not conditioning the temperature data logger first
A device carried in from a hot corridor and switched on immediately in a cold room will log its own warm up and not the room. It is important to bring the data loggers to the room temperature first before starting the temperature mapping study.
6. Skipping the summer study
A CRT warehouse that behaves perfectly in December can breach 25 °C repeatedly in May. That is why a temperature mapping study done in only one season gives you half the picture. The space may pass in one season and fail in the other.
In summer, the building takes in heat all day through the roof, walls, and dock doors. The HVAC runs longer and closer to its limit. Hot spots form near the roof, on upper racks, along sun facing walls, and close to loading bays. A space that held steady in winter can show zones above 25 °C by the afternoon.
Winter brings the opposite risk. In many parts of India, night temperatures drop sharply. Areas near outer walls, shutters, and the floor can fall below 15 °C. For products labelled 15 to 25 °C, that is also an excursion, and a summer only study would never catch it.
This is why the initial temperature mapping study should cover both summer and winter. Temperature mapping in both seasons shows the full range the space goes through. It reveals the true hot and cold spots, confirms whether the HVAC can hold the range under the worst load, and tells you where to place permanent monitoring sensors. After the initial study, repeat the temperature mapping whenever the layout, HVAC, or building changes, and at a fixed interval set by your risk assessment.
The same applies to vehicles. A reefer truck or delivery van that passes easily in winter can struggle in summer. The body heats up in direct sun, the cooling unit works harder, and every door opening lets in hot air that takes longer to clear. Long routes, traffic, and midday loading add to the load. Vehicle temperature mapping in summer shows how the vehicle performs when the risk is highest, and how long doors can stay open before products are at risk.
Temperature mapping in both seasons gives you data that holds up in an audit and protects your products all year round.
7. No Access Logs or Power Cut Record
Power cuts are a reality in many parts of India. Without a power cut test, sudden temperature spikes in your monitoring data often stay unexplained. Over time, these small spikes can turn into major deviations and lead to product losses.
A power cut test, also called a power failure or hold time study, is done as part of the temperature mapping study. Power to the HVAC or cooling unit is switched off on purpose while data loggers keep recording. This shows how the space behaves when cooling stops.
The test answers three key questions. How long does the space stay within its temperature limits after power is lost? Which locations breach first? And how long does it take to return to the required range once power is restored?
With these answers, you can compare the hold time against your actual outage history and your backup power setup. If your DG set takes 10 minutes to start and the space holds for 45 minutes, your products are safe. If the space breaches in 8 minutes, you know you need a faster backup or a better plan.
The results also help you write a clear SOP for power failures. Your team will know how much time they have, which products to move first, and when to raise an alarm. When a spike does appear in your data, you can link it to an outage and explain it with confidence during an audit.
A power cut test turns guesswork into data. It protects your products, supports your deviation investigations, and shows auditors that your facility is ready for real world conditions.
8. Filing the report as a formality and doing nothing
Some cold chain facilities treat the temperature mapping report as a formality. They file it away for audits and inspections and never act on it. Others publish a report that is full of data but leads to no clear decision. Then problems show up in daily temperature monitoring, and they wonder why excursions keep happening even after a temperature mapping study was done.
The WHO states that the fundamental purpose of a temperature mapping study is to identify temperature deviations affecting the storage area, so that remedial action can be taken. WHO also lays out the process in four stages. The last stage is to implement the recommendations by carrying out the remedial and other actions identified in the thermal mapping report, followed by a new mapping exercise if needed to verify that those actions worked. It goes further and says that the final outcome and purpose of a thermal mapping exercise is the implementation of the report recommendations. In simple words, a report that does not lead to action has not done its job.
End to End Temperature Mapping with Lisaline Asia
Most companies buy data loggers and then discover the harder part. Someone still has to plan the grid, place the devices, run the study for the right duration, analyse the readings and produce a report that an auditor will accept.
When you buy your loggers from Lisaline Asia, you do not have to solve that yourself. We conduct the entire temperature mapping study for you, and we have been doing it for leading pharmaceutical companies and hospitals across India for more than 28 years.
Our Data Loggers Work for Both Temperature Mapping and Temperature Monitoring
This is the part most buyers get wrong. Temperature mapping and temperature monitoring ask different things of a device, and companies often end up paying twice because nobody explained the difference at the point of purchase.
For the temperature mapping study
You need many loggers at once, for a short period. Our offline USB models are built for exactly this. They are affordable enough to deploy in the numbers a proper grid demands, and they record reliably without needing any network.
Retrieving the data is simple. Plug the logger into a laptop or computer through the USB port and the readings download straight away, with no software licence or gateway required.
For permanent temperature monitoring
You need a few devices in fixed positions with live visibility and real time alerts. We supply those too, and we install them at the hot and cold spots the study identifies.
With cloud connected loggers, the dashboard becomes one place where readings from every device sit together. You can compare them side by side and see immediately which spot is fluctuating and which is holding steady.
So one supplier covers both stages, and your permanent monitoring goes exactly where the temperature mapping data says it should.
Timestamped, Audit Ready Reports
Every reading our loggers produce is timestamped, which is what turns a set of numbers into a defensible audit trail. Each record carries the time it was taken and the serial number of the device that took it, so any reading in your report can be traced back to a specific calibrated unit.
Reports download in PDF and CSV. The PDF is the presentable record you can place in front of an inspector without reworking anything. The CSV is what lets you consolidate every logger into one view and compare positions point by point, which is how hot and cold spots are actually confirmed.
When an auditor asks how you know a particular zone stayed within range last March, the answer is a document rather than an explanation.
Calibration Is Already Handled
Every logger used in a temperature mapping study needs a valid calibration certificate behind it. Missing or expired certificates are the single most common finding we see during audits, and the problem is entirely avoidable.
Most of our data loggers come with a 6 point validation certificate. That goes beyond the WHO requirement, which asks for a minimum of 3 calibration points bracketing the range being studied.
Some of our loggers arrive pre calibrated from the manufacturer. The rest are calibrated by us at our own ISO 17025 accredited, NABL certified laboratory, either in lab or on site depending on what suits your operation. Either way the certificates are current, traceable to each device serial number, and filed directly into your temperature mapping report.
How We Run Your Temperature Mapping Study
We survey and grid your facility
Our technicians measure each thermally separate area and record the layout, including racking, cooling units, air outlets, doors and existing sensors. The space is then divided into a measurement grid, with a calibrated logger placed at every grid position and stacked at low, middle and high levels so vertical stratification is captured as well as horizontal variation.
We identify your hot spots and cold spots
Once the study period ends, the readings from every logger are consolidated and compared position by position. This is what reveals the warmest and coldest points in your space. Cold spots deserve as much attention as hot ones, because freezing damage to vaccines and biologics is permanent and leaves no visible trace on the vial.
We tell you exactly where your permanent loggers belong
This is the finding that changes your daily operation. Instead of sensors sitting wherever an installer found a convenient wall, they sit at the points that will breach first. If the warmest and coldest positions both stay within range, everything between them almost certainly does too.
We find the gaps in your cold chain
A temperature mapping study surfaces problems that routine monitoring will never show you. Uneven readings point to blocked air outlets, failing door seals, weak insulation or a refrigeration unit that cannot cope with peak summer load.
Power outages during the study are captured in full, showing when the supply dropped, how long it stayed down and how quickly the temperature climbed. Open door studies show how far the temperature rises near the entrance and how long recovery takes. Power failure studies give you the number that matters most in an emergency, which is how many minutes your space holds before stock is at risk.
We submit a formal report
Our temperature mapping reports are produced through in house developed software, following a certified protocol, with the calibration certificate for every logger used included in the annexes.
What Our Temperature Mapping Service Covers
Using ISO 17025 certified measurement sensors, we carry out thermal temperature mapping for laboratories, walk in cold rooms, warehouses, refrigerated vehicles and other controlled environments.
- 24 hour loaded and empty temperature mapping, or a duration set by your own protocol
- Open door and power failure studies
- NABL certified wireless or standard data logger systems used across every study
- Protocols reviewed and approved by you before our technician arrives on site
That last point matters more than it appears. The protocol is agreed in advance, so scope, duration and acceptance criteria are settled before anyone reaches your facility and there are no surprises once the study is running.
Compliance Built In
Our data loggers are designed to meet the requirements your auditors and customers ask about, including GDP, FDA 21 CFR Part 11 for electronic records, and EN 12830 for temperature recorders used in transport and storage. The report you receive is structured to go in front of an inspector without reworking.
Compliance varies by device, since different loggers are built for different applications. Check the specific product page or datasheet for the standards each model meets, or ask our team and we will confirm which device fits your regulatory requirement.
Temperature Monitoring After the Temperature Mapping Is Done
Once the study has identified where your sensors belong, we supply the systems that live there permanently.
For storage facilities
Our real time monitoring loggers and sensors connect over LoRaWAN, Bluetooth or Wi-Fi. LoRaWAN suits large warehouses and multi building sites where range matters and cabling is impractical. Wi-Fi works where you already have coverage. Bluetooth suits smaller spaces and racking that is difficult to reach.
All of them push readings continuously with real time alerts, so you hear about an excursion while there is still time to act on it.
For shipments in transit
Our GSM 4G data loggers report from the road. Readings reach you wherever you are in the world, rather than waiting until the consignment is unloaded and the device is downloaded.
That is the difference between intervening during transit and discovering a breach after delivery, when the only decision left is whether to reject the consignment.
More Than Temperature Mapping
Temperature mapping is one part of what we do. Lisaline Asia supports your cold chain monitoring across its full lifecycle.
That includes in lab and on site calibration of temperature, humidity and CO2 sensors from our NABL accredited laboratory. Installation and commissioning with IQ and OQ validation. Annual maintenance contracts for wireless datalogging systems and refrigerated units across India and South Asia. Validation and PQS testing, including PQS E006 testing for electronic and chemical temperature measuring devices, with reports submitted to WHO for qualification. And 24x7 online support with remote access, so you can check performance and receive deviation alerts at any hour.
Planning a Temperature Mapping Study?
Our team handles the protocol, the grid, the loggers, the calibration and the final report. Tell us about your facility and we will scope it for you.
Your Partner in Cold Chain Monitoring Since 1998
For over two decades, we have helped pharmaceutical, vaccine, biologics and life science companies protect the products that matter most. We bring trusted global equipment, local expertise and hands on support together under one roof.
We introduced the world's first miniaturised Vaccine Vial Monitor in India
That milestone set the tone for everything we do. Since then, we have worked to preserve the integrity of vaccines, biologics and other temperature sensitive products across the cold chain.
Global brands. Local presence.
We supply monitoring solutions from leading international manufacturers, along with our own USB temperature data logger built for Indian cold chain needs.
Authorised Supplier, Not Just a Reseller
We are an authorised supplier for the brands we carry. You get genuine products, proper warranty support and a partner who stays with you after the sale.
Complete Monitoring Range
From single use temperature indicators to USB, Bluetooth, Wi Fi and 4G data loggers, we help you pick the right device for storage, transport and export shipments.
NABL Accredited Calibration
Calibration is done at an ISO/IEC 17025 NABL accredited facility. Choose on site calibration at your premises or send your units to our lab.
Validation and Temperature Mapping
Our team supports your compliance needs end to end.
- IQ and OQ validation
- Temperature mapping of warehouses, cold rooms and vehicles
- WHO PQS testing support
Setup and Cloud Integration
We program your data loggers, set alarm limits and connect them to cloud platforms, so your team starts monitoring from day one without guesswork.
Trusted by Cold Chain Facilities
Our equipment is used in major cold chain facilities around the world. When you work with us, you get the same proven technology backed by a team that understands your operations.
Looking for reliable cold chain monitoring?
Talk to our team about equipment, calibration, validation or temperature mapping for your facility.
Conclusion
Temperature mapping answers the question you started with. Where should you actually place your temperature data loggers and monitoring sensors?
It also makes monitoring your cold storage facility far simpler than it was before. A completed study shows you clearly which spots are safe for temperature sensitive products, which spots are not, and which locations are most likely to fluctuate. Instead of watching an entire warehouse and hoping the sensors are in sensible places, you are watching the handful of points that genuinely decide whether your stock stays within range.
That clarity turns into decisions you can act on. You will know whether your permanent monitoring sensors are sitting in the right positions or need to be repositioned. You will know whether you need to add more loggers to cover a zone nobody was watching. You will know which bays should be marked as unsuitable for your most sensitive products, and which parts of the space can safely hold the rest.
The study only holds up if the instruments behind it do. Guidelines from WHO, CDSCO and EU GDP all point to the same basic requirement. The data loggers used for thermal mapping should carry a 3 point calibration certificate, with the calibration points bracketing the range being studied, and an accuracy of within plus or minus 0.5 °C at each point. Those certificates need to be valid on the dates of the study and traceable to each device serial number, because readings that cannot be tied back to a calibrated unit carry no weight in an audit.
Finally, the study needs to end in a proper report. It should state the objectives, describe what was mapped and why, present the minimum, maximum and mean temperature for every logger position, identify the hot spots and cold spots, and carry the calibration certificates in its annexes. Most importantly it should end with a conclusion you can act on, telling you exactly what to move, what to fix and where your sensors belong. A report that simply records numbers has not finished the job.
If you are looking for affordable data loggers for thermal mapping in your storage facility or shipment vehicle, our team at Lisaline Asia can help. You get the devices and the study together, so the loggers arrive calibrated, the mapping is conducted by our own trained technicians, and you receive a report that is ready for your next audit.
FAQs- Temperature Mapping in Cold Chain Storage and Shipments
Have more questions about temperature mapping than what the guide answered, we might have answers for you here.
How long should the temperature mapping study be held in cold storage facilities?
| Type of space | Typical duration | Why |
|---|---|---|
| Warehouses and ambient stores | At least 7 consecutive days, covering 5 working days and 2 weekend days | Captures day and night cycles, and the gap between busy weekdays and quiet weekends |
| Cold rooms and freezer rooms | 24 to 72 hours, or longer if justified | Less affected by outside weather, so a shorter study is usually sufficient |
| Rooms with duplicate cooling units | Long enough to cover each unit running separately, ideally for similar periods | Temperature distribution can change depending on which unit is running |
What are hot spots and cold spots in temperature mapping?
In every temperature mapping study, two terms are really important to identify where to place your temperature sensors or data loggers. These are hot spots and cold spots and WHO defines them precisely. A hot spot is a location within your cold storage facility thatrecords the highest temperatures during the studybut still stays in the allowed safe limit. In a 15 °C to 25 °C store, a hot spot might sit between 23 °C and 25 °C. Similarly a cold spot is the location recording the lowest temperatures, while still staying inside the safe range. In the same store, a cold spot might sit between 15 °C and 17.5 °C. You need to note this. Both hot and cold spots are still within range. A point that goes outside the range is not a hot spot, it is a deviation, and it needs corrective action or a no storage marking.
Should you place a temperature data logger or sensor at hot or cold spots for monitoring?
Yes, you should place temperature sensors or data loggers at hot or cold spots within your cold storage facility. This is because these spots are at the highest risks of a temperature deviation. Especially hot summers, the hot spots might change to deviations and the cold spots might lead to freezing damage.
EU GDP clause 3.2.1 settles it in one line. Monitoring equipment should be positioned in the areas that experience the extremes of fluctuations. Extremes, plural. CDSCO says the same thing in clause 12.5, asking for monitors in the areas most likely to show fluctuations.
The logic behind it is simple. If your warmest point and your coldest point both stay within range, everything between them almost certainly does too. Two well placed sensors give you that assurance.
What is seasonal temperature mapping and why is it necessary?
Where a storage area is affected by outside weather, WHO suggests at least two studies, one in the warmest season and one in the coldest. Those two represent the worst cases and establish whether the space holds temperature through the year. WHO also notes that two season mapping is typically not necessary for cold rooms and freezer rooms, since they are insulated from outside conditions by design.
How does temperature mapping help you prepare for a power cut?
Sometimes during temperature mapping, the power is deliberately cut and the loggers record how long the space holds within range before product is at risk. That single number tells you whether your backup arrangement is genuinely adequate. It sets your generator sizing, your escalation window and how fast someone has to respond. If an unplanned outage happens during the study, the data captures that too, including the time it went and how far the temperature climbed. In Indian facilities where outages are routine, this is often the most useful figure the whole temperature mapping study produces.
How does temperature mapping account for door openings?
Temperature mapping accounts for door openings by building them into the study. The door is opened at a defined frequency and duration, stated in the protocol and acceptance criteria before the study begins, so the effect is measured rather than guessed. The loggers show how far the temperature rises near the entrance, which racking bays are affected, and how long recovery takes. WHO guidance is that temperature should return within the defined limits within a maximum of 30 minutes after an opening. If it does not, the finding usually points to a door seal, an air curtain, or a change in how goods are received, and it tells you whether a monitoring sensor near the door is worth adding.
Do cold boxes and passive shipping containers need temperature mapping?
Yes, and the principle is the same as a cold room. Loggers are placed inside the packed box at its weakest points, which are usually the corners, the top layer and the area closest to the coolant packs. The box is then tested against hot and cold ambient profiles that match the lanes you actually ship on. This tells you the real hold time of your configuration instead of the figure printed on the brochure. One important point here. The box must be qualified with the exact pack out, coolant type and conditioning you intend to use in the field. Change the number of gel packs or the conditioning time and the hold time changes with it, which means the earlier qualification no longer applies.
Should you use different data loggers for temperature mapping and monitoring?
In most cases, you should use different data loggers for temperature mapping and monitoring because the two jobs need different things from the device.
Temperature mapping needs many loggers at once, often dozens, placed in a temporary grid and collected once the study is over. What matters here is that every unit is the same model, carries a tight calibration certificate, and starts recording at the same moment, otherwise the readings cannot be compared point by point. The data is downloaded at the end rather than watched live, so alarms and connectivity add cost without adding value. Compact USB or wireless loggers suit this well.
Temperature monitoring needs the opposite. Only a few devices are used, they are installed permanently at the hot and cold spots the mapping identified, and they push data continuously or at short intervals. Here live visibility, reliable alarms and uptime matter far more than deploying in numbers. Wireless, Wi-Fi or GSM systems are built for this.
A calibrated wireless logger can genuinely do both jobs. A single use shipment logger cannot serve as a fixed monitoring sensor, and a basic USB logger will not alert you to anything. For shipments the same split applies. A single use data logger inside the carton records the journey for the receiver, while a GSM device reports from the road so you can act before delivery rather than after.
Mapping loggers and monitoring devices do different jobs
Both record temperature, but they are built for different tasks and it is worth not confusing the two when you buy.
| Aspect | Loggers used for mapping | Devices used for routine monitoring |
|---|---|---|
| How many | Many, often dozens, for a short period | A few, permanently installed |
| Placement | Temporary, in a planned grid | Fixed, at hot and cold spots |
| What matters most | Identical devices, tight calibration, synchronised start | Live visibility, real time alerts, uptime |
| Data access | Downloaded at the end of the study | Pushed continuously or at short intervals |
| Typical choice | Compact USB or wireless loggers | Wireless, Wi-Fi or GSM systems with real time alerts |
For shipments, the same logic applies. A single use logger travelling inside the carton records the journey, while a GSM device reports from the road so you can act before delivery rather than after.
How many data logger devices do you actually need for temperature mapping?
The number of temperature data logger devices you require depends on the grids. A data logger grid every 5-10 metres, stacked at 3 or more heights at each point plus extra near doors and cooling units, adds up quickly. A small cold room may just need a dozen. A large warehouse needs considerably more. Map out four storage facility properly into grids and you can calculate the number of data logger devices you actually need for temperature mapping.
Who signs a temperature mapping study report?
The report content, including data sheets, results, spreadsheets and graphs, should be audited and peer reviewed by a competent independent person. That person confirms and signs the major reported results and the recommendations arising from them.
The word independent is the important one. It means someone who was not part of the team that ran the study. That can be a QA person from your own organisation, as long as they had no involvement in conducting the mapping, or it can be a reviewer from outside. Either works. What does not work is the person who placed the loggers also signing off on their own analysis.
Where a third party produced the report, the person who commissioned the study approves it.
This is how it works when Lisaline Asia carries out the mapping. Our team runs the study and prepares the report, with the calibration certificates for every logger used included in the annexes. The report is then reviewed and signed internally by our technical lead. It comes to you for approval by your responsible person, usually the QA head or the person accountable for the facility, and their sign off is what makes it a valid record for your site. You hold the approved report, and we retain a copy along with the calibration records behind it.
How to analyse a temperature mapping report?
For each logger position, the report records the minimum, the maximum and the mean temperature over the study, along with a yes or no against the acceptance criteria.
Read the means alongside the extremes. WHO makes the point that mean values help confirm true hot and cold spots, because a single spike tells you less than a location that sits consistently high. A logger that touched 8.2 °C once during a door opening is a different story from one that averaged 7.8 °C all week. Both need attention, but for different reasons and with different fixes.
How often should you remap your storage facility?
WHO suggests periodic remapping, giving every three years as an example, depending on your routine monitoring strategy. Where multiple fixed monitors already provide continuous data, a periodic re-evaluation of all system performance since the initial mapping may be more appropriate than a full repeat study. Beyond that schedule, remapping is triggered by events.
| Trigger | Examples | Action |
|---|---|---|
| Routine schedule | Two to three years since the last study | Full remap, or a documented review of monitoring data |
| Change to the space | New racking, changed layout, a pattern of use that increases loading or alters air circulation | Remap the affected areas |
| Change to equipment | New or replaced refrigeration unit, a change to the set point | Remap and requalify |
| Unexplained data | Monitoring records show variability outside normal operating limits with no known cause | Investigate, then remap to confirm |
| After corrective action | Air outlets adjusted, insulation repaired, sensors moved | Follow up study to verify the fix worked |
| Seasonal gap | Only one season has been studied so far | Complete the second season study |